One of the hardest parts of being a developer is working with bug reports and support requests disguised as bug reports. Some people write very good bug reports. These reports give me the information I need to reproduce the problem and advise from there. Others offer a vague description of their problem with no context. These cases are tough.
Recently, I had a bug report for a hard to reproduce issue. The person who provided the bug report followed a guide I gave to Cobalt Strike 3.0’s beta testers. He provided everything the guide asked for. It was beautiful. I had the exact information I would try to get if I were sitting at his computer working the issue.
In this blog post, I’d like to share the bug report guide I gave to Cobalt Strike 3.0’s beta testers. If you need to send a bug report or request support, email support@strategiccyber.com.
1. Describe the problem with as much context as possible
When you report a bug [or request support], try to answer these questions:
1. What are you trying to do?
2. Which steps did you take to accomplish this?
3. What happened?
4. What did you expect?
5. Which steps did you take to troubleshoot it?
Here’s an example:
“I’m trying to use the DNS Beacon (windows/beacon_dns/reverse_http). I setup an A record for malwarec2.losenolove.com on my team server. I pointed NS records for profiles.losenolove.com and game.losenolove.com to malwarec2.losenolove.com. I’m not able to get a system in my customer’s environment to call back. I don’t know how to troubleshoot further.”
The above is useful. It gives me context about the problem the user is experiencing. In the case of the DNS Beacon, it’s pretty easy to troubleshoot with information about the beacon domains and the address of the team server. It also helps me to know if you’re seeing something in a test lab or a customer’s environment. When you report a bug, it’s better for both of us if you can reproduce it in a test lab. A test lab is better because then we can have a dialog about the factors in play. A customer’s environment is very hard. There are too many unknowns that can affect the outcome of some task
This example is also useful because it provides specifics about the user’s configuration from the get go. In the case of a C2-related question, listener information is key. If you have trouble sending a phish, a copy of your phishing template is useful too. Anything you can provide me that allows me to look at a question in my local lab is going to lead to better resolution of a question or bug report.
2. Your Environment
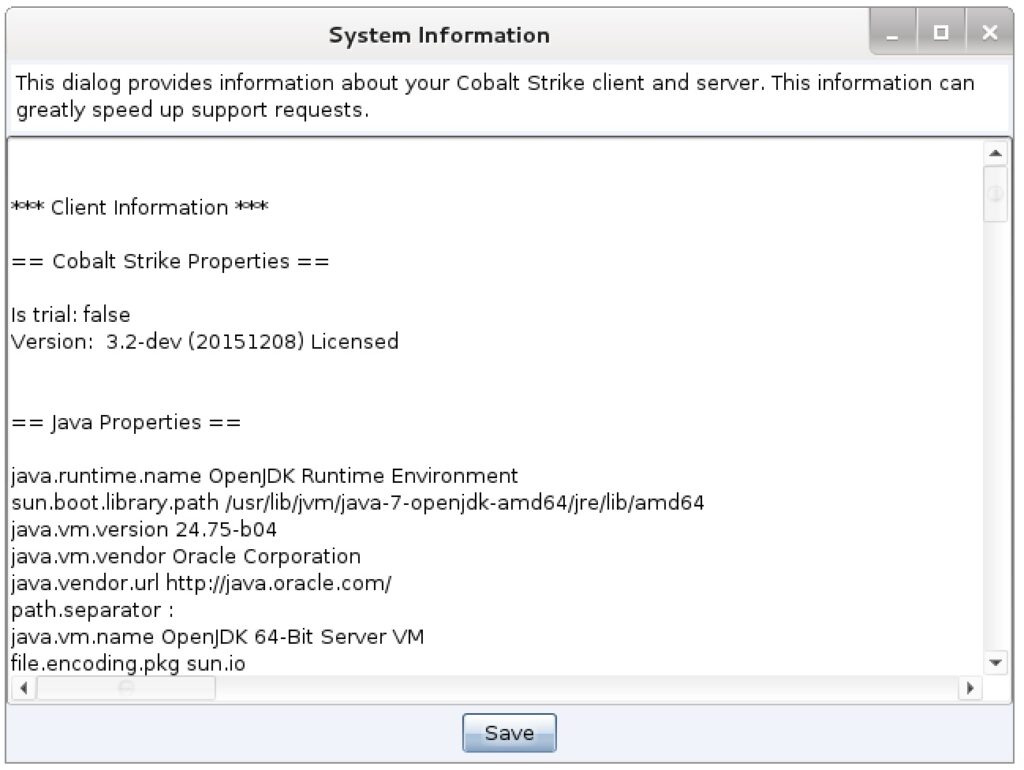
The next thing I need to know is information about your Cobalt Strike environment. It’s important for me to know which version of Cobalt Strike you’re using and which version of Java. Fortunately, Cobalt Strike 3.0 makes this very easy. Go to Help -> System Information. This will generate a system information summary for your Cobalt Strike client AND team server.
Over time, as I come up with more contextual factors I want to know about your Cobalt Strike client, I will update this feature to provide them.

3. Console Messages
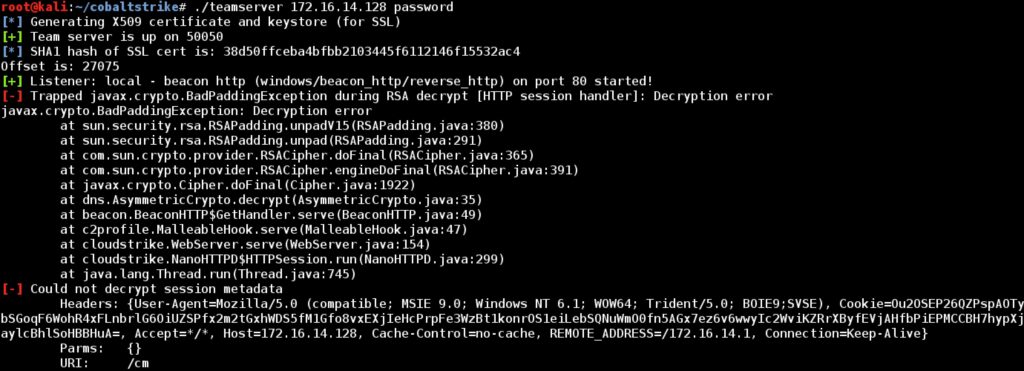
Cobalt Strike 3.0 has a global class called MudgeSanity. It’s named this, because the purpose of this code is to help me keep my sanity. Cobalt Strike 3.x passes all notifications (routine), unexpected situations, and errors through this MudgeSanity class. Right now, the MudgeSanity class prints its messages to the Cobalt Strike team server console and to the console the client was started from. When you file a report or ask a question, it’s very helpful to provide all of the output of the Cobalt Strike client and team server in your initial query. Please don’t paraphrase this information. Screenshots, cellphone photos of your screen, and copy/paste are all equally fine.

4. List of Threads and Stack Traces
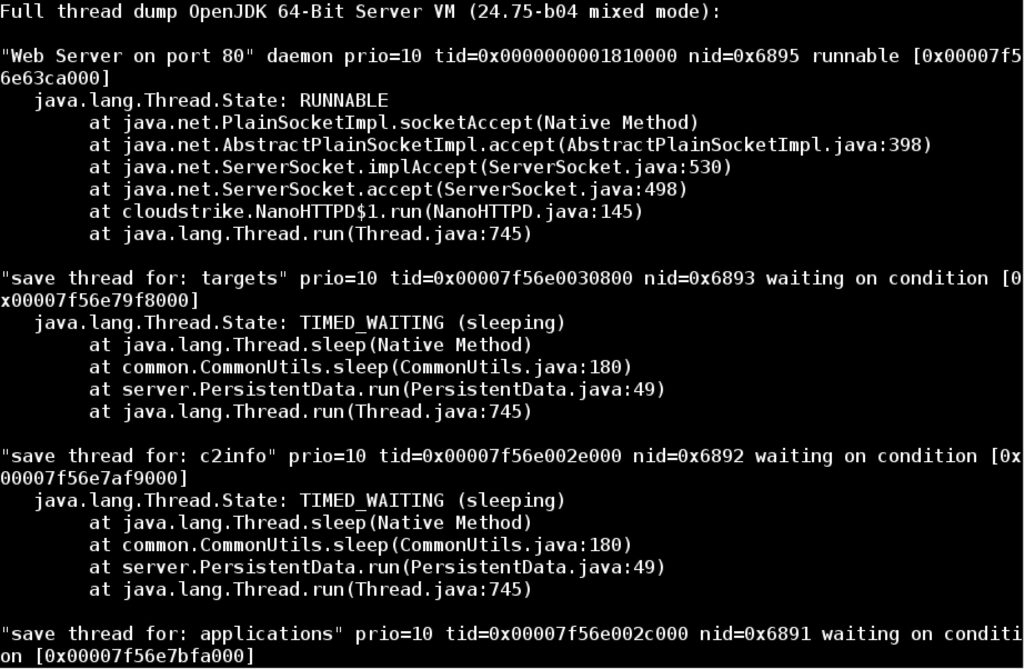
If Cobalt Strike deadlocks [freezes, either the server or the client] OR if you notice Cobalt Strike is eating your CPU, it will help if you dump a list of all threads currently running in Cobalt Strike. This is easy to do on Linux with the kill command. Use ps waux | grep java to find the Java processes that are running. Use kill -3 [PID] to request the Java process dump a list of all threads with a detailed stacktrace for each. As a bonus, if this feature detects a deadlock, it will say so. If a deadlock occurs AND I have this information from both the team server and the client, I have a really good chance of fixing it.

Also, run ps -eLo pid,lwp,nlwp,ruser,pcpu,stime,etime,args | grep java and send the output of this with your stack trace. This command will list the light-weight-process associated with each Java thread and how much CPU it’s using. This information will allow me to map high CPU use back to a specific thread.
5. Memory Use
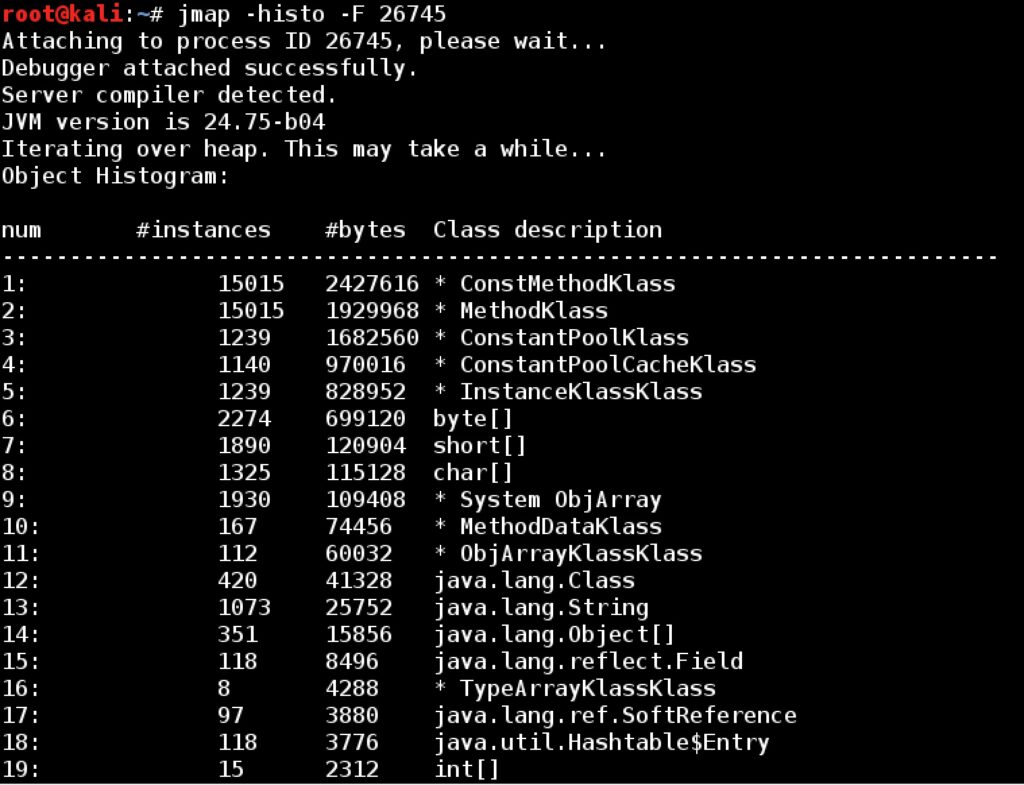
If your Cobalt Strike team server or client seems like it’s hogging memory, consider dumping a summary of your Java heap. The jmap tool that ships with Java makes this easy. The preferred output comes from jmap –histo:live [PID]. If this gives you an error, try: jmap –F –histo [PID]. These commands will dump a full summary of Java objects in memory. If you provide me with this information for both your team server and Cobalt Strike client—it will help me to track down memory leaks or memory-related performance issues.
